Grafana is an open-source, data visualization and multi-platform supported monitoring tool which offers detailed analytics, monitoring, and visualization of real-time system data in the form of charts and graphs. The frontend of Grafana is written in Typescript and the backend is written in Go. Grafana lets you create notifications, alerts, and ad-hoc filters. Install Grafana on Ubuntu 20.04. It offers the capability for integration with data sources such as Graphite, Influx DB, Elasticsearch and Prometheus, etc.
In today’s tutorial, we will learn how to install the Grafana on Ubuntu 20.04 operating system.
Prerequisites
- Linux Operating System (Ubuntu 20.04).
- Access of the Root User or User with Sudo privileges.
Add Grafana Repository
By default, The Grafana package is not available in the default Ubuntu 20.04 repositories. So, we need to manually add the Grafana official repository on Ubuntu 20.04 server.
- First, we need to update the server packages list and repositories. To update the server repositories run the following command.
sudo apt-get update -y
- Now we need to install some per-required dependencies for the Grafana with the following command.
sudo apt-get install vim wget curl gnupg2 apt-transport-https software-properties-common net-tools -y
- Run the following command to download and add the Grafana GPG key.
sudo wget -q -O /usr/share/keyrings/grafana.key https://packages.grafana.com/gpg.key
- Now add the Grafana repository to APT with the following command.
echo "deb [signed-by=/usr/share/keyrings/grafana.key] https://packages.grafana.com/oss/deb stable main" | sudo tee -a /etc/apt/sources.list.d/grafana.list
- After adding the repository to the server. Now, we need to update the repositories with the following command.
sudo apt-get update -y
Grafana Installation
- Now, we can easily install the Grafana package by running the following command on the server.
sudo apt-get install grafana -y
- Once the Grafana package is installed on the server, we can easily verify the Grafana installation with the following command.
grafana-server -v
- Now start the Grafana service with the following command.
sudo systemctl start grafana-server
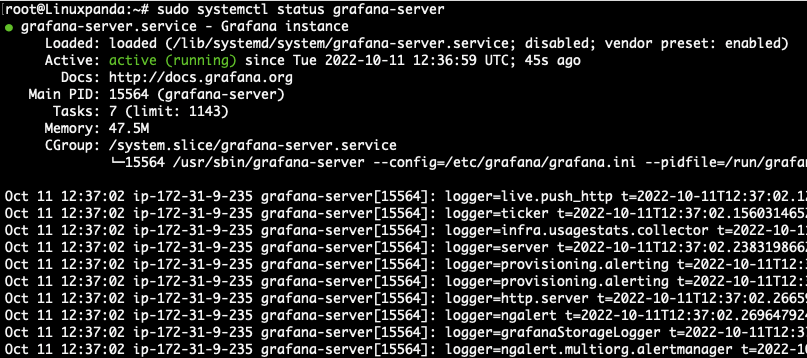
- To check the status of the Grafana service run the following command.
sudo systemctl status grafana-server

- By default, The Grafana service starts and listens on the port 3000. To check the port run the following command.
sudo netstat -tulpn | grep 3000
You will get an output like this.

- To access the Grafana simply copy and paste the server’s public IP with the port on the browser.
http://Server_Ip:3000
Configure Nginx as a Reverse Proxy for Grafana
To access Grafana on a particular domain or subdomain, we need to configure the Nginx as a reverse proxy for Grafana.
- To install the Nginx on the server run the following command.
sudo apt-get install nginx -y
- Start the Nginx service with the following command.
sudo systemctl start nginx
- To check the Nginx service status run the following command.
sudo systemctl status nginx

- After installing the Nginx on the server, create an Nginx virtual host configuration file with the following command.
vim /etc/nginx/conf.d/grafana.conf
- Copy the paste the following configuration into Nginx virtual host.
server {
        server_name grafana.linuxpanda.com;
        listen 80 ;
        access_log /var/log/nginx/grafana.log;

    location / {
                proxy_pass http://localhost:3000;
                proxy_set_header Host $http_host;
                proxy_set_header X-Forwarded-Host $host:$server_port;
                proxy_set_header X-Forwarded-Server $host;
                proxy_set_header X-Forwarded-For $proxy_add_x_forwarded_for;
        }
}
Replace “grafana.linuxpanda.com” with your desired domain or subdomain from the above configuration file. Save and exit from the file.
- Now verify whether the Nginx configuration file is valid or not with the following command.
nginx -t
You will get an output like this.

- Restart the Nginx service to save and apply the changes on the server with the following command.
sudo systemctl restart nginx
Grafana Dashboard
To access the Grafana dashboard run your domain or subdomain in the URL section of the browser which you have configured in the above section. The Url will redirect you to the Grafana login page.
- To login into the Grafana dashboard use default credentials which are admin/admin as user and password.

- After login with default credential, we need to set a new password for Grafana dashboard. Then click on Submit button.

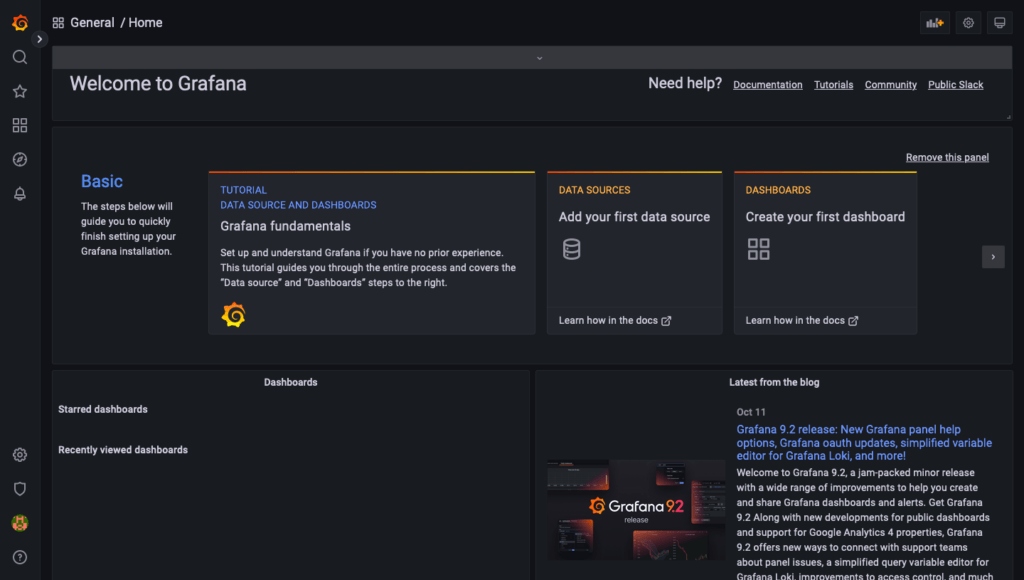
- After setting up the new password, you will be automatically redirected to the Grafana main dashboard.

Read Also: How to Push Docker Image on Docker Hub
Conclusion
In this tutorial, we have learned how to install Grafana on Ubuntu 20.04. Grafana is one of the mostly used graphical monitoring tools which offers incredible capabilities like dynamic dashboards, data visualization and extensive alert capabilities etc.
For more details you can visit the Grafana’s official and community-built dashboards and plugins. To learn more about using Grafana in general, see the official Grafana documentation.


Leave a Reply